
UpDiagram provides multiple work views, including: Kanban board, grid view, mind map, calendar view and gantt chart for users to manage their projects.
A GridView is a web control that displays data in a tabular format with columns representing fields and rows representing records. It’s widely used in web applications to manage large sets of data efficiently.
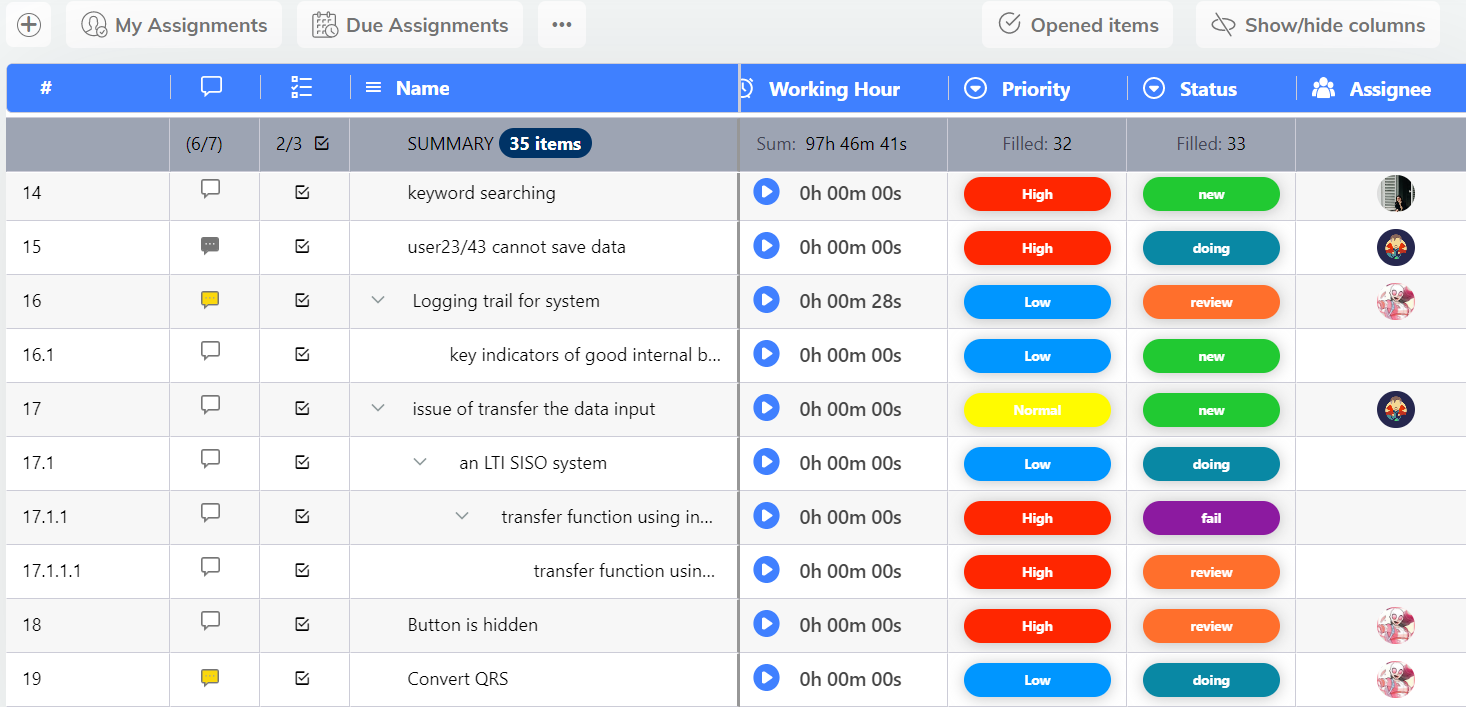
You can set a grid view for your project by clicking on “Work Views” and choosing “Grid”.
You just need to select your task and then you can place it at anywhere you want in the table
UpDiagram will automatically rearrange the number of tasks for you.
Filter task is easier than ever with the steps in the video below
You can sort the column by clicking on the title of each column
The Kanban Board is a highly effective visual aid that provides a comprehensive view of the current status of work and streamlines team communication. It serves as a critical component in the Kanban methodology, which facilitates the optimization and continuous improvement of any business process.
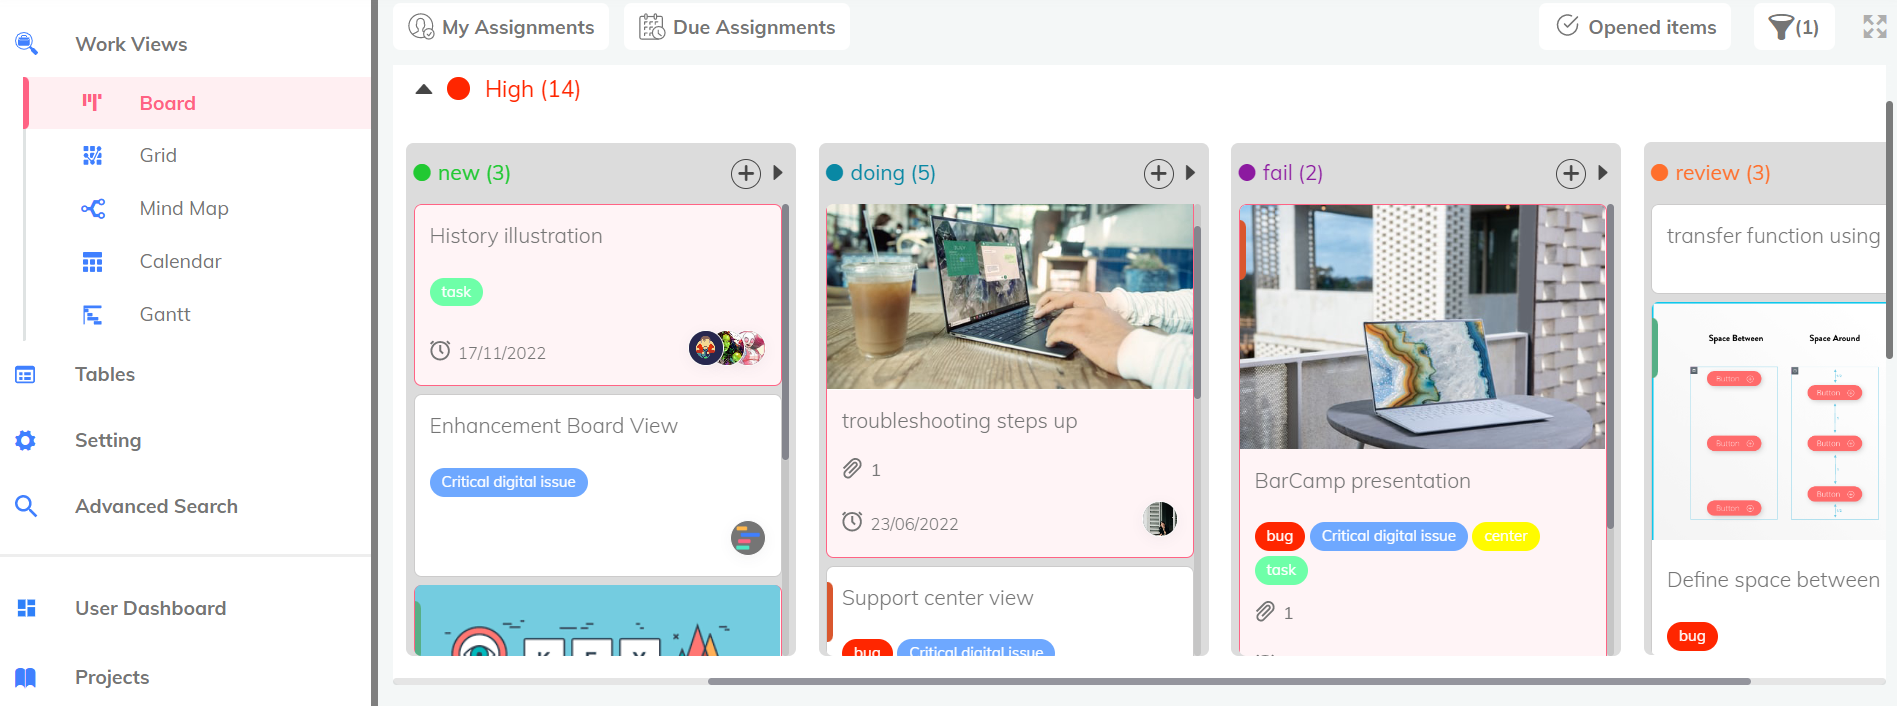
You can set a grid view for your project by clicking on “Work Views” and choosing “Board”.
Note: You can set what field will appear at your board view by going to Setting and clicking on “Custom View”. You can see instructions here
You just need to double click in your task and then drag and drop it in the column you want.
Go to the Filter and click “Add filter”, then choose the fields you want to see.
You can delete your filter by selecting “Remove filter” or selecting “Clear all filters” if you don’t want to filter any longer.
Note: UpDiagram currently does not support sorting for this view.
For professional project managers, Mind Map is like “eyes” to help managers have a more intuitive view. Comprehensive, simple, and clear are the characteristics of the Work View Mind Map of UpDiagram.
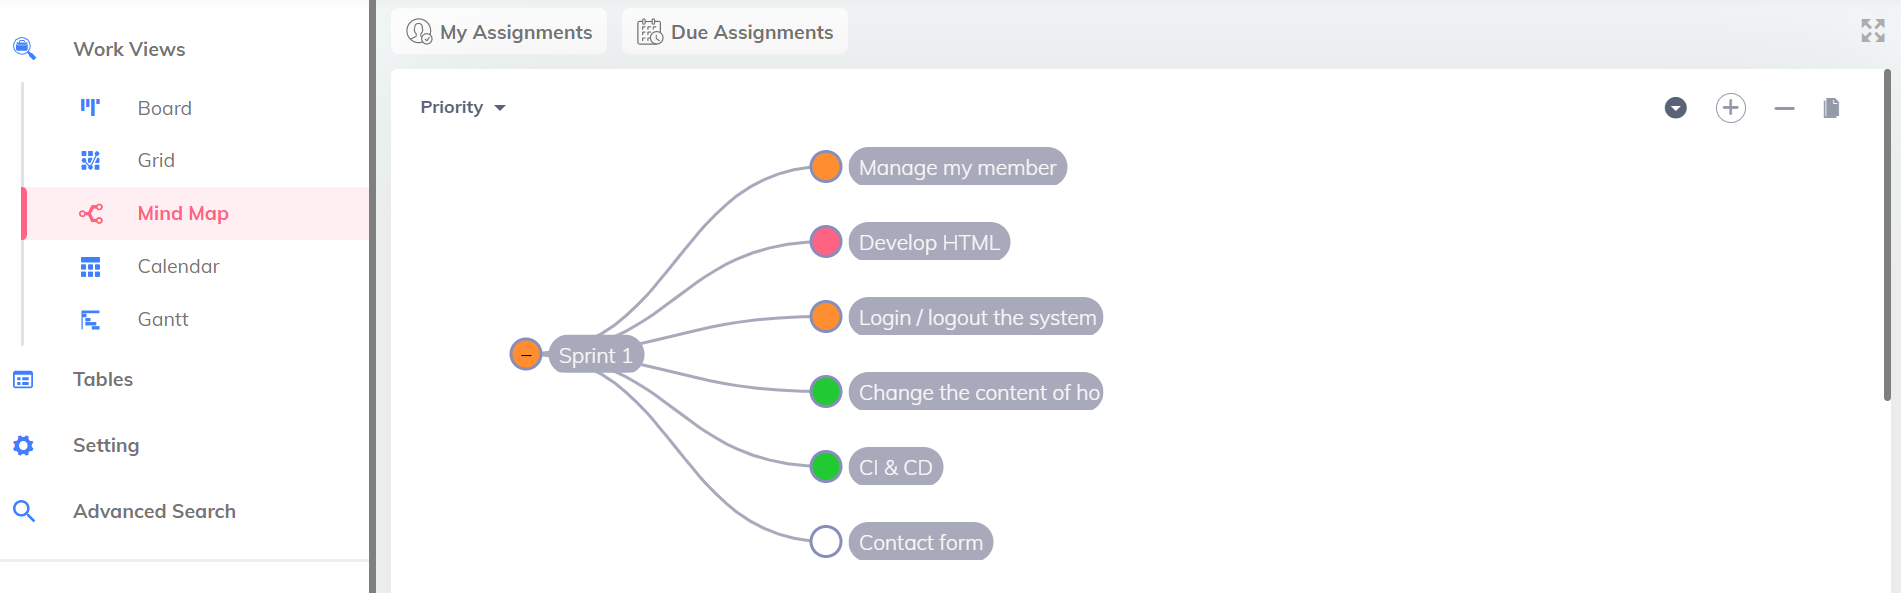
Note: UpDiagram currently does not support drag and drop tasks for this view.
You can filter your tasks based on the fields and the type of those fields is in list
Note: UpDiagram currently does not support sorting for this view.
The Gantt Chart view is the most commonly used view in Project. It lists the tasks in your project, and illustrates their relationship to one another and the schedule using Gantt bars.
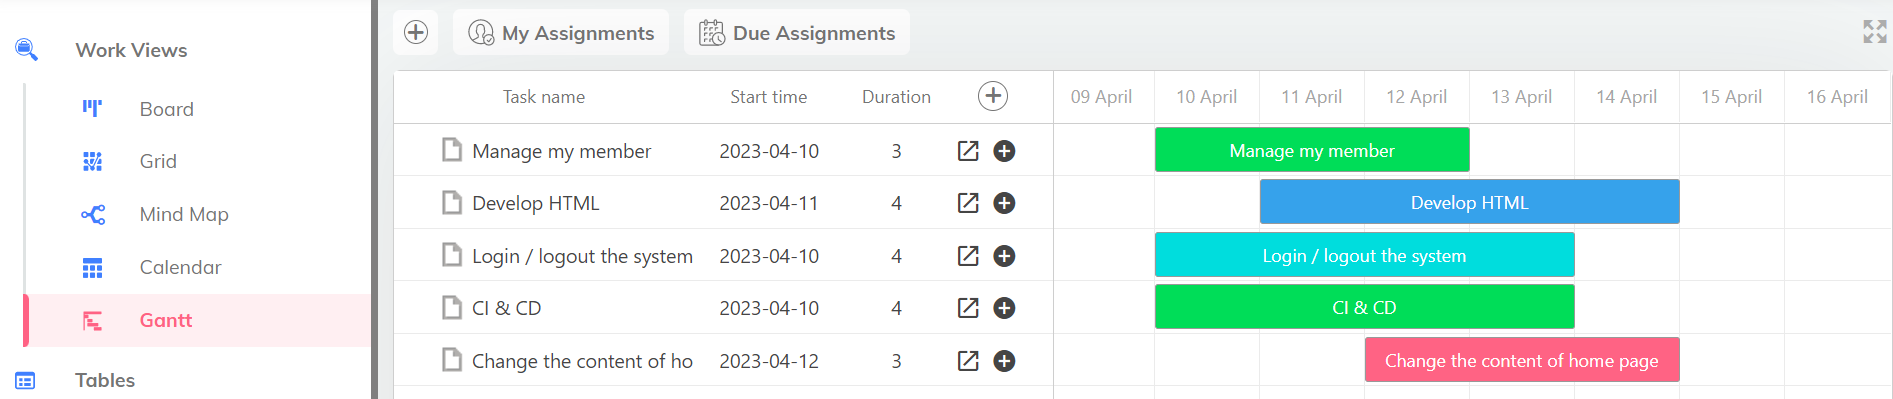
You can drag and drop to change the timeline of the tasks
Note: UpDiagram currently does not support filter and sorting for this view.
UpDiagram’s calendar with a clear interface optimizes the view of the project’s time. Allows quick task manipulation according to project changes. Is an integral part of an Agile project.
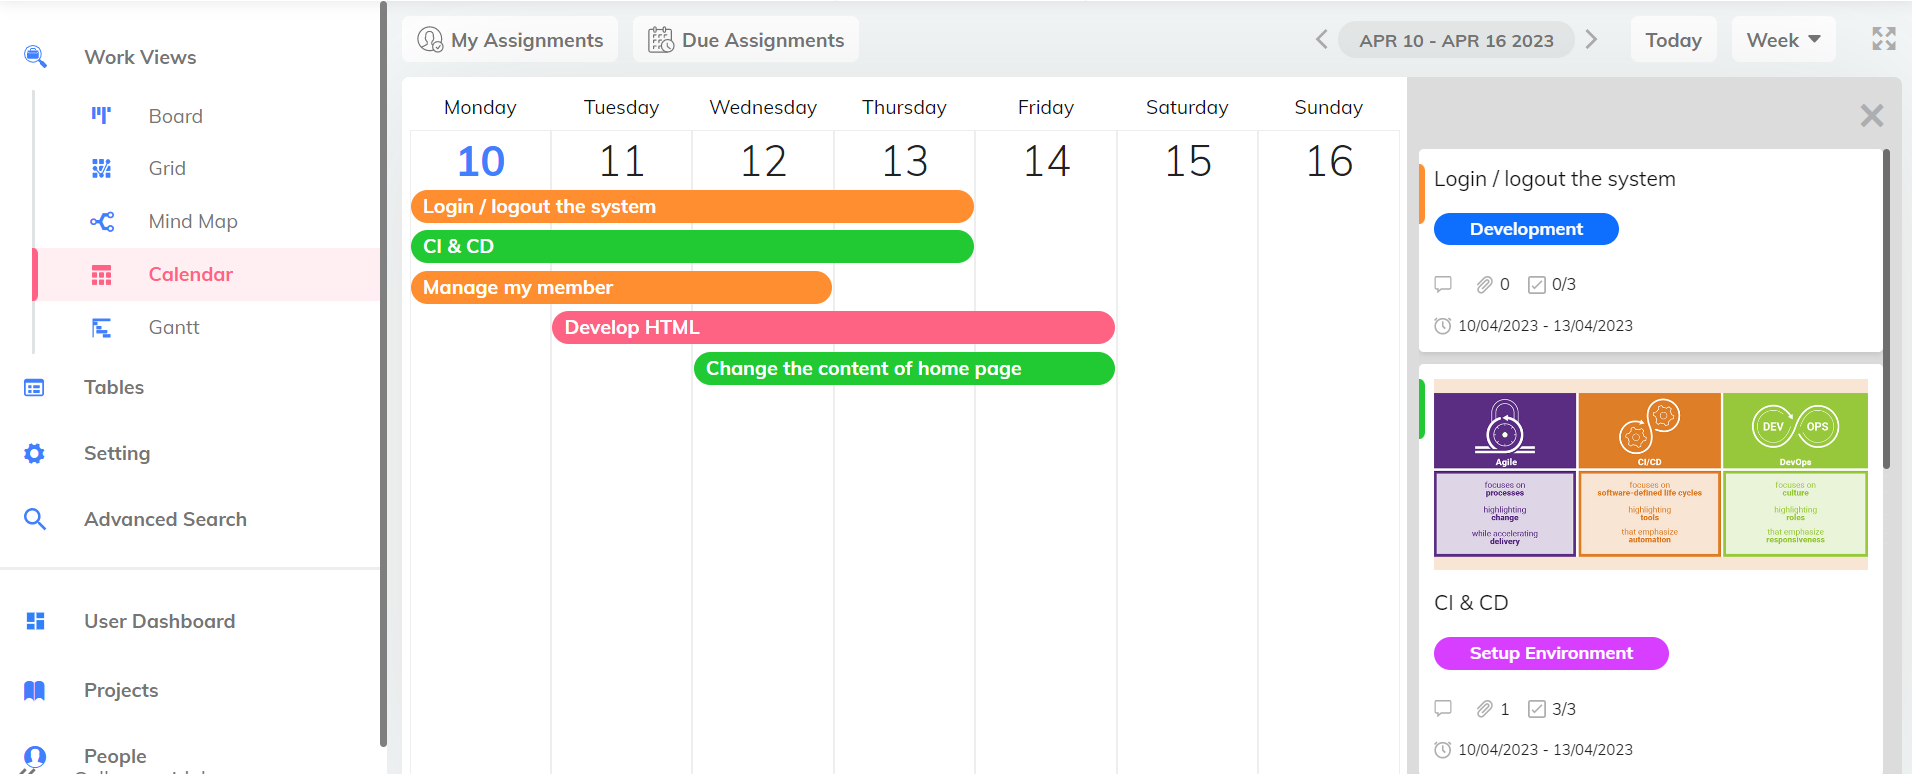
Note: UpDiagram currently does not support drag, drop, filter and sorting for this view.