
Managing projects is never easy. Project managers often struggle with juggling deadlines, dependencies, and team coordination. This is where the benefits of using Gantt charts shine through.
A Gantt chart is a simple yet powerful tool that makes timelines and task management much clearer. From PMO projects to software development, marketing campaigns, construction, accounting, and HR, Gantt charts can adapt and bring order to chaos. Let’s explore how this classic project management method still proves essential in today’s fast-paced world.
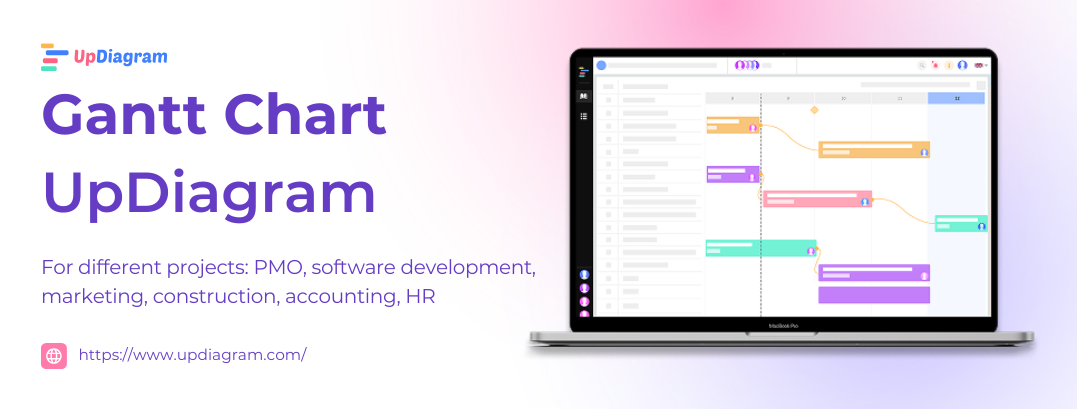
A Gantt chart is a timeline tool that helps visualize tasks, track progress, and manage resources effectively. By displaying activities on a linear timeline, project managers can see what needs to be done, when it should be completed, and how tasks depend on one another. In short, Gantt charts provide visibility, reduce confusion, and help teams stay aligned.
The popularity and efficiency of Gantt charts have been documented in academic research. According to Wilson (2003), Gantt charts have endured for more than a century because they remain one of the most effective tools for coordinating tasks, improving productivity, and supporting managerial decision-making. Originally developed as part of Frederick Taylor’s Scientific Management system, Gantt charts proved indispensable in aligning factory workflows, reducing bottlenecks, and ensuring accurate delivery promises. Their continued use in project management today highlights both their adaptability and efficiency as a planning tool.
Even outside the corporate world, Gantt charts have gained popularity. From CEOs to creative entrepreneurs, many well-known leaders rely on Gantt charts daily to keep track of goals and schedules. The tool’s simplicity and adaptability make it universally effective.
Project Management Offices (PMOs) often coordinate multiple initiatives at once. Without a clear system, timelines quickly clash, and resource allocation becomes guesswork. Gantt charts solve this by providing a visual portfolio overview.
Alignment with strategy: According to PMI’s Pulse of the Profession report (2021), organizations with standardized project management tools (like Gantt charts) deliver 33% more projects on time and within budget. A global IT services firm adopted Gantt charts across its PMO to synchronize 50+ projects worldwide. By mapping dependencies, they cut resource conflicts by 25% and improved stakeholder reporting through clear visual dashboards.
PMOs use Gantt charts to align project timelines with quarterly or annual business goals, ensuring executives see where projects overlap or support each other. Gantt charts in PMOs are especially useful when managing enterprise-wide transformation initiatives where multiple teams, budgets, and outcomes must be coordinated.
Software projects are notorious for scope creep and missed deadlines. Gantt charts provide much-needed structure.
Managing Agile/Waterfall: While Agile favors Kanban boards, many hybrid teams still rely on Gantt charts for milestone tracking. The Standish Group CHAOS Report found that only 31% of software projects succeed on time; teams using structured scheduling tools report significantly fewer delays.
For example, a SaaS company used Gantt charts to map sprint cycles and release milestones. By aligning developer tasks with QA testing and client review deadlines, they reduced average release delays by two weeks. Software managers turn to Gantt charts when planning multi-sprint releases, integrating third-party vendors, or presenting progress to non-technical stakeholders.
Ultimately, Gantt charts bridge the gap between detailed Agile boards and the big-picture timeline executives expect.
Marketing thrives on timing launch too late, and opportunities vanish.
A CoSchedule survey found that marketers who proactively plan projects are 356% more likely to report success.
A retail brand launching a holiday campaign used Gantt charts to align social media, design, influencer partnerships, and PR deadlines. The result: a 20% increase in campaign engagement compared to the prior year when schedules were siloed. Gantt charts keep campaign tasks such as content production, ad spend, and event launches visibly connected, ensuring deadlines don’t slip during peak periods.
For marketing teams, Gantt charts provide the clarity needed to coordinate multiple moving parts in a campaign that often runs on non-negotiable deadlines.
Few industries depend on timelines as heavily as construction. One missed milestone can delay an entire project.
Industry risk: McKinsey reports that 98% of large construction projects are delayed or over budget. Gantt charts provide contractors and managers with phased schedules that identify bottlenecks before they cascade.
A mid-sized construction firm used Gantt charts to track subcontractor schedules on a high-rise project. By visualizing dependencies foundation, framing, inspections they finished two months ahead of competitors using less formal scheduling. Gantt charts clarify handoffs between subcontractors, regulatory deadlines, and material deliveries preventing costly downtime.
In construction, Gantt charts aren’t just helpful, they’re essential.
Back-office functions often go overlooked, yet deadlines here are equally critical.
Accounting and HR teams adopt Gantt charts when they need to synchronize recurring, compliance-driven tasks that affect multiple departments.
Here, Gantt charts help ensure smooth, reliable operations beyond just project delivery. By applying Gantt charts in these areas, organizations ensure smooth operations beyond just project delivery

Rather than offering a single generic answer, the value of Gantt charts becomes clearer when viewed per project type:
Of course, not every project needs a Gantt chart. For small, ad hoc tasks, simpler tools like Kanban boards may be more efficient. But when stakes are high and dependencies are complex, Gantt charts remain the gold standard.
No matter the industry, the benefits of using Gantt charts are universal: they bring clarity, accountability, and efficiency. From aligning PMO projects to simplifying HR workflows, Gantt charts prove to be an indispensable project management tool.
Start managing your projects smarter with Gantt charts today, UpDiagram is the best solution for your project management challenges.
If you want to experience these advantages firsthand, try UpDiagram – a Productivity Management Platform. With built-in Gantt chart features, UpDiagram helps you track tasks efficiently and manage projects smarter.